 Videos
 Photos


How the Pandemic Affected Armenian Economy and Public Finance
Introduction
The 2018 April events culminated in Serz Sargsyan stepping back from the power and the election of Nikol Pashinyan as the prime minister of Armenia by the ruling Republican Party under the pressure of street protests.
The new prime minister (PM) promised reforms in the public sector, a fight against corruption, a fair justice system and new economic opportunities that he called an economic revolution.
During the first year of his term in the office economic indicators went up slightly. In my opinion, this additional increase (compared to the previous forecasts) in the economy was largely the result of shadow economy uncovering to some degree, as the private sector and the public in large had positive expectations from the new government.
Beginning in 2020, COVID-19 reached Armenia and on March 15 the government declared a state of emergency to prevent the further spread of the virus. Many economic restrictions were enforced. Schools, universities and almost all public institutions and many businesses launched a distance working mode.
The government enacted financial support programs to ease the negative consequences of restrictions. After lifting the state of emergency in September, the government declared a state of quarantine. However, the restrictions were largely eased and most economic activities were allowed to enter a “normal” mode. In spite of the restrictions and safety rules, the virus spread rapidly as the public did not follow the rules strictly and the government was falling short to effectively impose them. The first peak of daily confirmed cases with COVID was in June 2020, the second was in October 2020 and the third peak is unfolding now (April 2021).
As of April 10, 2021 there are more than 202,000 confirmed cases with COVID-19, about 900,000 tests were conducted, fatal cases from the virus are 3,720 and 952 from other causes (confirmed having COVID). The number of confirmed cases per million population is 68,149 and number of deaths per million population is 1,255 (permanent number of the population in Armenia is 2.964 million as of January 1, 2021).
This article is aimed at depicting how the pandemic affected the economy and particularly the public finance. The socio-economic situation in the country further deteriorated because of the war over Nagorno-Karabakh (Artsakh in Armenian) that started in the end of September 2020, as Azerbaijan launched artillery offensive along the entire line of contact. The war lasted 44 days and had devastating effects. Practically, it is impossible to separate the negative socio-economic effects of COVID from those of the war, but clearly the situation further exacerbated because of the latter.
This text will analyze solely the financial (fiscal) implications and will not go into discussing the political crisis that the country is currently going through.
Economy
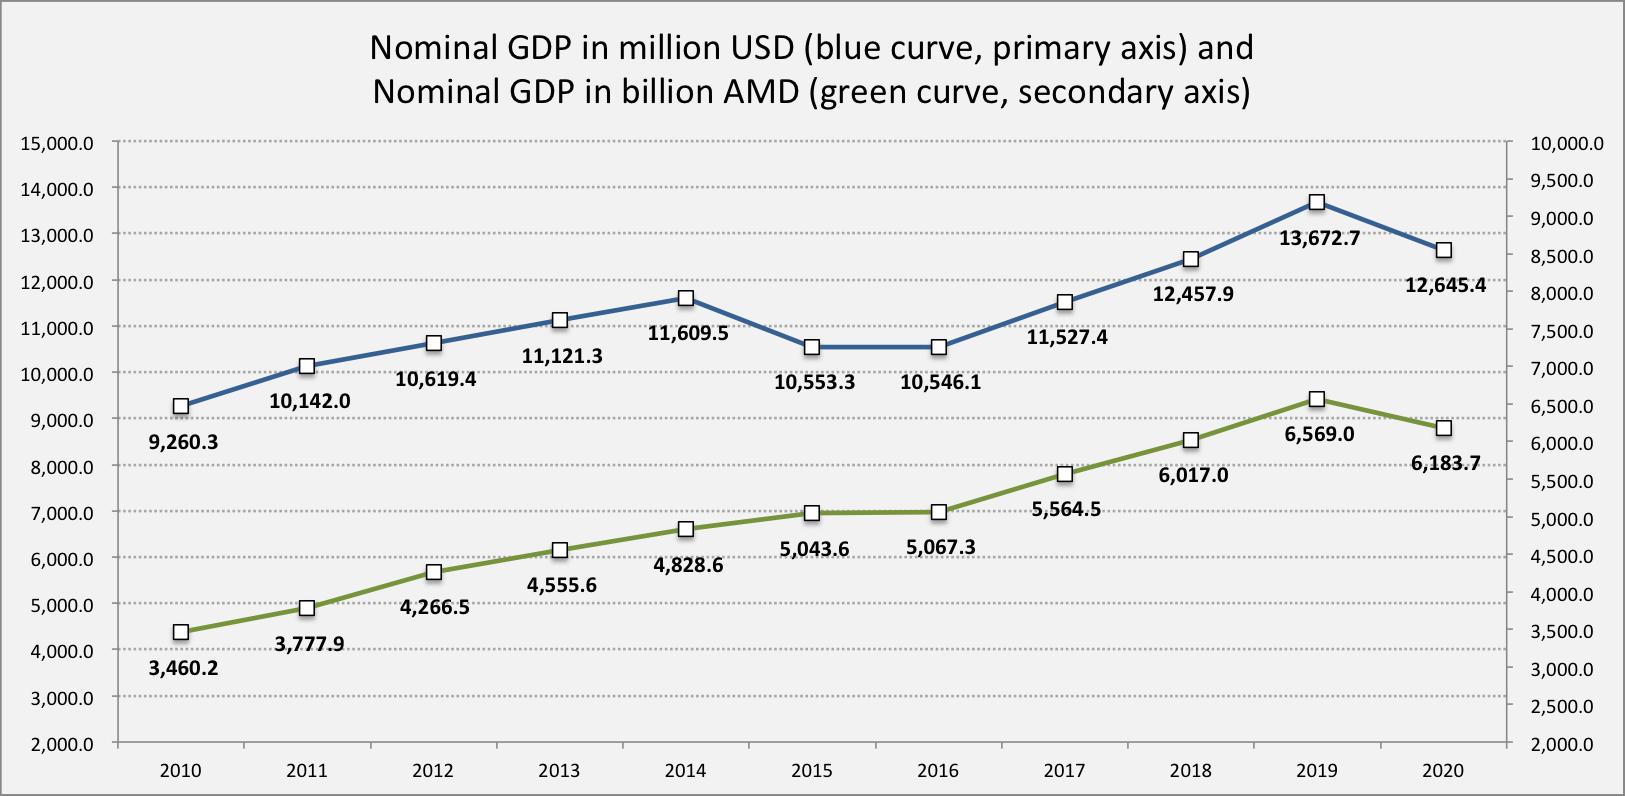
The following curves (Graph #1) show nominal GDP in million USD (primary axis) and in billion AMD (secondary axis). As we see, the GDP sharply declined in 2020. According to the Statistics office, GDP data for 2020 is preliminary.
Graph #1
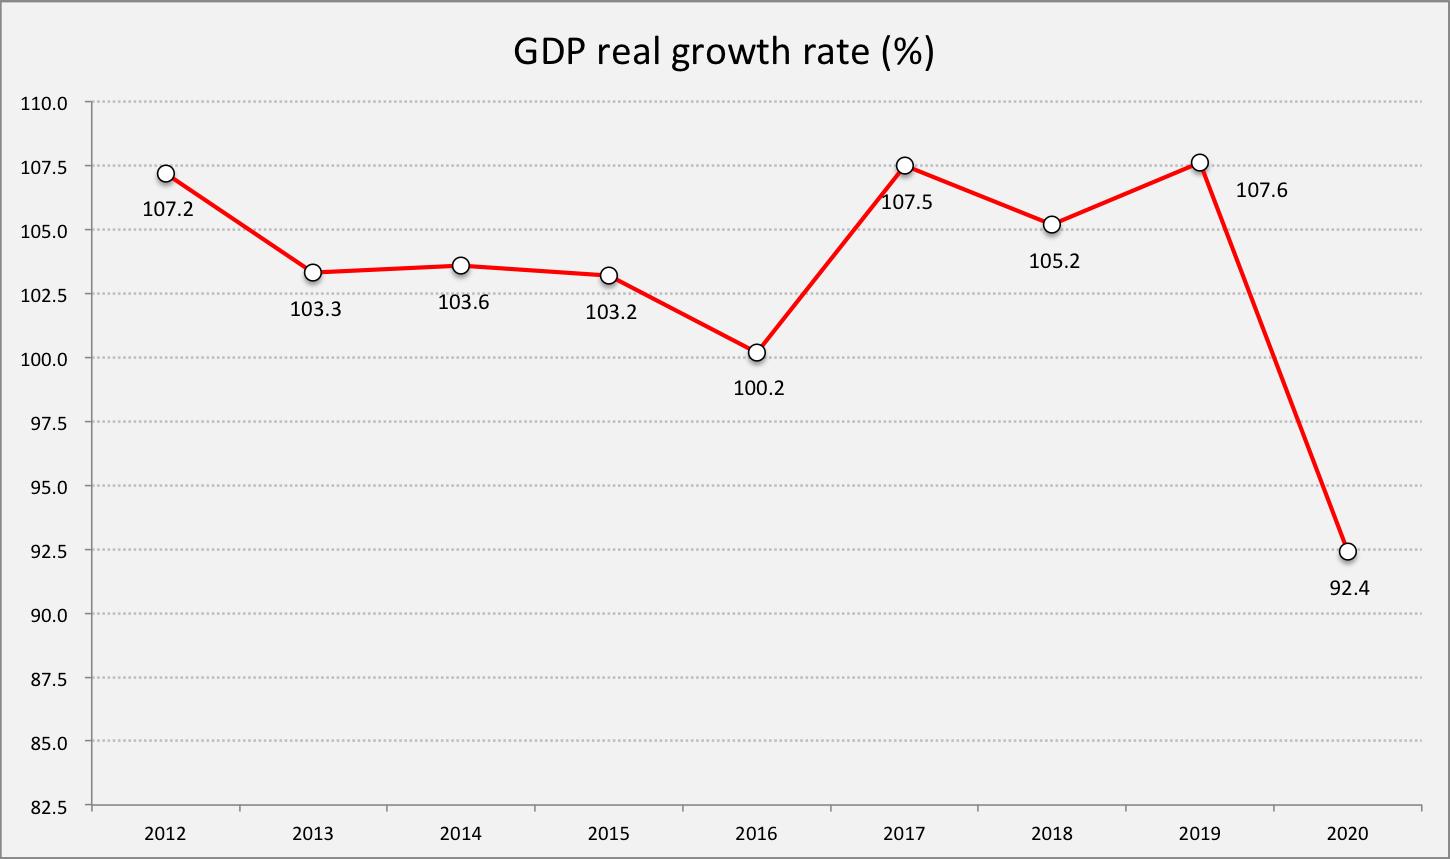
This graph depicts the curve for the GDP real growth rate (Graph #2). As the graph shows, in 2019 the real growth rate for the economy was 7.6%, which is equivalent to the growth rate in 2017. In 2020, the economy declined sharply with similar percentage points. This decline is mostly due to economic restrictions related to the Government management of the epidemic situation in the country: lockdown, state of emergency and state of quarantine.
Graph #2
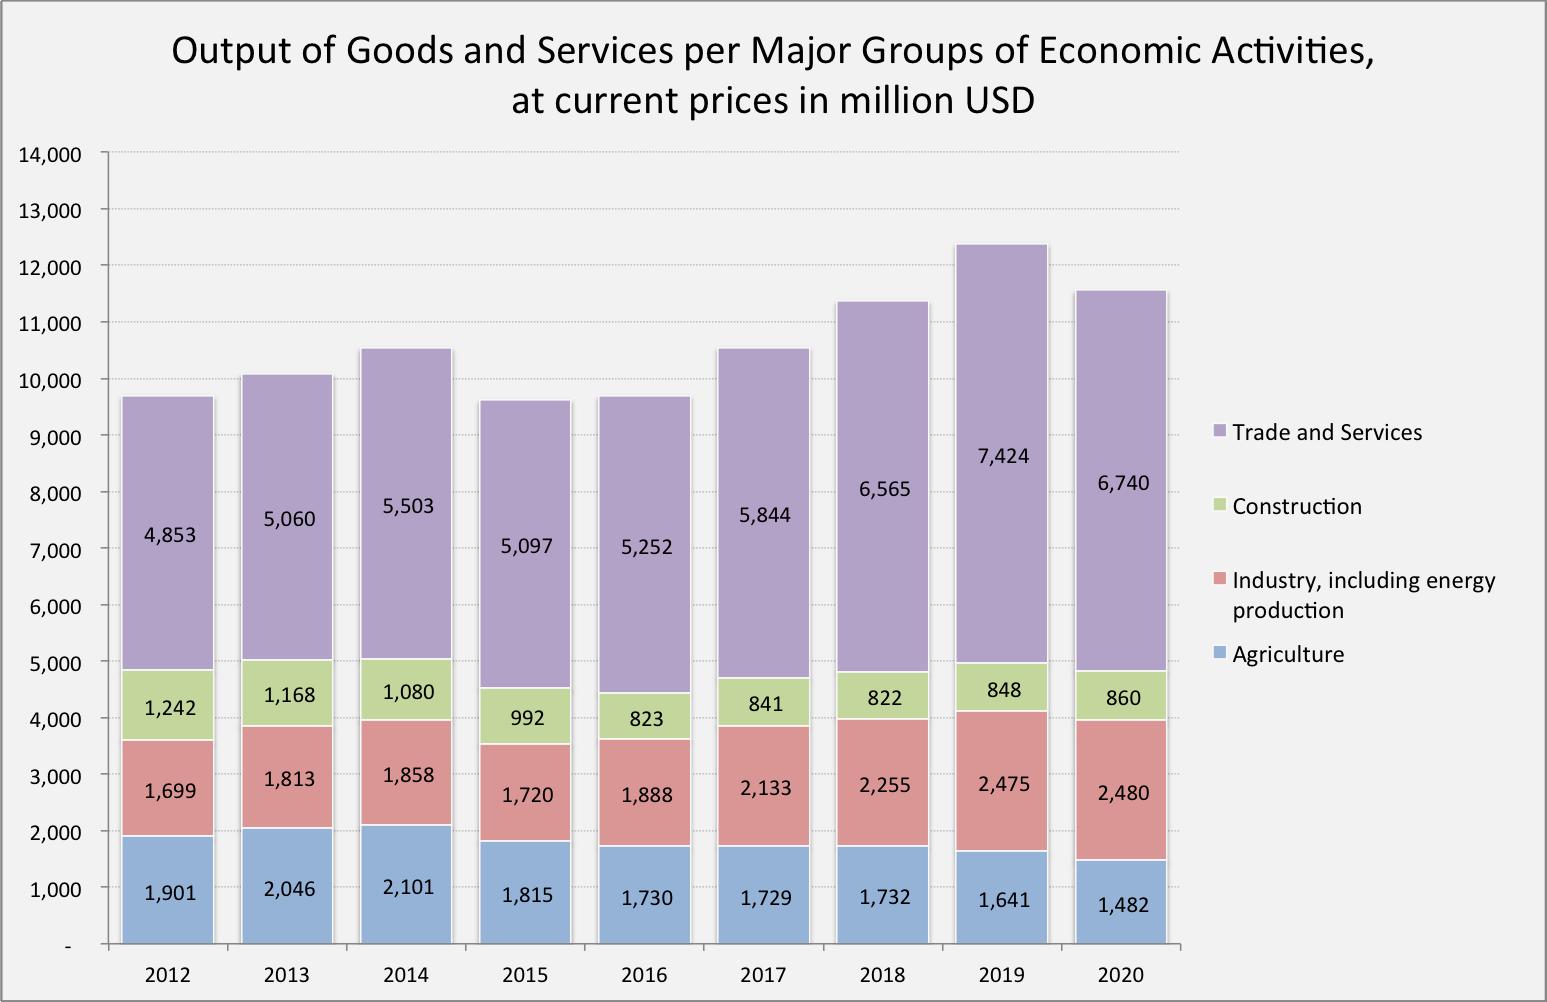
Let us examine the structure of economic activities per major groups to see what are the sectors that suffered most (Graph #3). As the graph shows, Agriculture and Trade and Services sectors are the ones that declined. Trade and Services is the hardest-hit sector, which in value terms declined by about 700 million USD (the value of the output), when compared with 2019.
Graph #3
In services sectors group the sharpest decline in 2020 compared to 2019 was recorded in the following sectors.
H. Transportations and warehouse economy: 33.7%.
I. Accommodation and food service activities: 45.1%.
N. Administrative and support service activities: 41.1%
R. Arts, entertainment and recreation: 28.4%.
Trade sector (G. Wholesale and retail trade; repair of motor vehicles, motorcycles) in the same period declined by 11.7%.
Public Finance
Against this background, government tax revenues declined and the state budget recorded much bigger deficit than it was planned initially. As a result, the government raised more public debt (compared to the plan) to cover the gap and overall debt burden on the country and the economy considerably increased. The following graph (Graph #4) depicts state budget revenues and expenditures. Factual data for 2020, according to the Statistics Office, is preliminary.
Graph #4
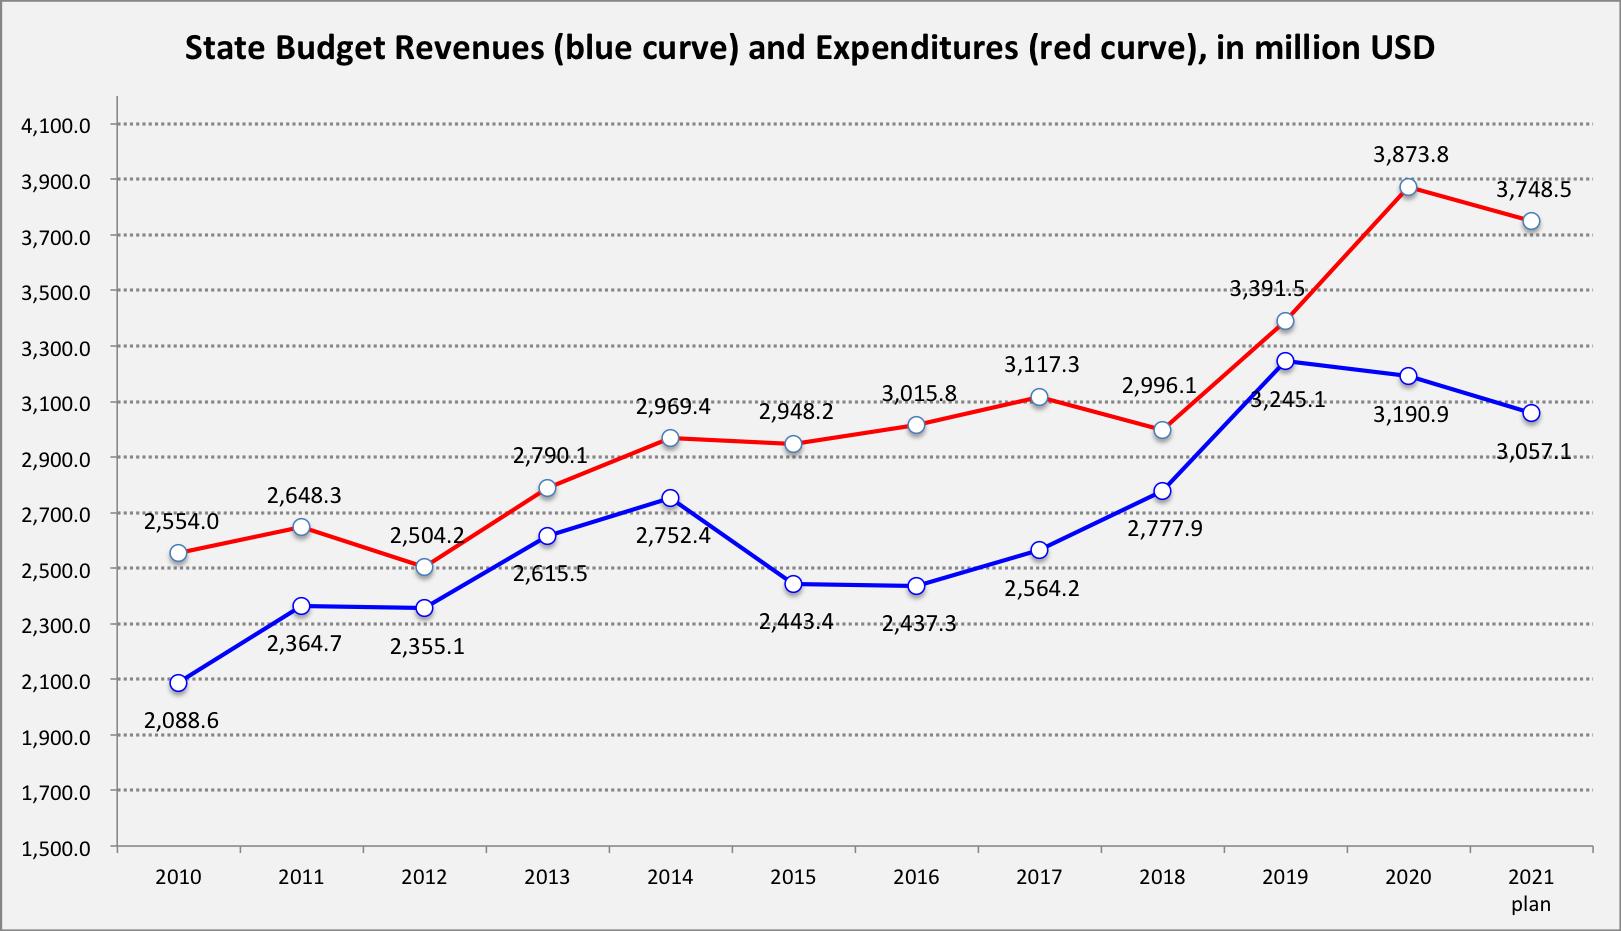
Note: USD-AMD exchange rate used for conversion in this graph (also throughout this text) is the annual average. For 2021, USD-AMD exchange rate is the one applied in the state budget (1USD = 493.76 AMD).
The gap between these two curves comprises the state budget deficit, which is mainly financed through government debt. This means, when the distance between the blue and red lines grows (and the blue curve is under the red one), the debt of the government also grows.
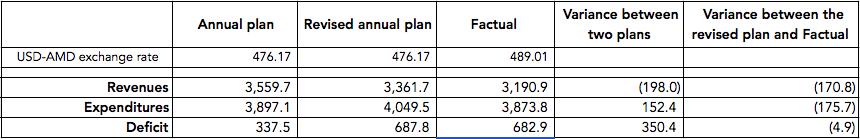
As seen in the graph, in 2020, the gap between the two curves has grown hugely, and the budget deficit is about USD 680 million. This is the largest state budget deficit for Armenia so far (since 2010 in this graph). Planned state budget deficit for 2021 is going to be very large again, about USD 690 million, which is about 18.5% of total planned expenditures of 2021.
State budget revenues declined in 2020. As we see in the Table #1, the initial plan was 3,559.7 million USD, the revised plan is less by about USD 200 million and the factual revenues were USD 3,190.9 million, which is less by USD 368.8 million, when compared with the initial plan. Relief programs (aimed at easing the negative consequences of economic restrictions related to the pandemic) caused the plan for state budget expenditures to rise, however, as we see, factual total expenditure number is not much different when compared with the initial plan. Finally, as we see, the state budget factual deficit doubled compared to the initial plan. The factual deficit (USD 682.9 million) compared to the initial plan is bigger by USD 345.4 million in 2020.
Table #1
The following is the breakdown of the state budget revenues into three major groups (Graph #5). As it is depicted in the graph (presented in logarithmic scale with 10 base), Taxes and duties declined sharply. The government collected about USD 200 million less tax revenues in 2020 compared to 2019. In 2019, the government collected about 440 million more in taxes and duties compared to 2018.
Graph #5
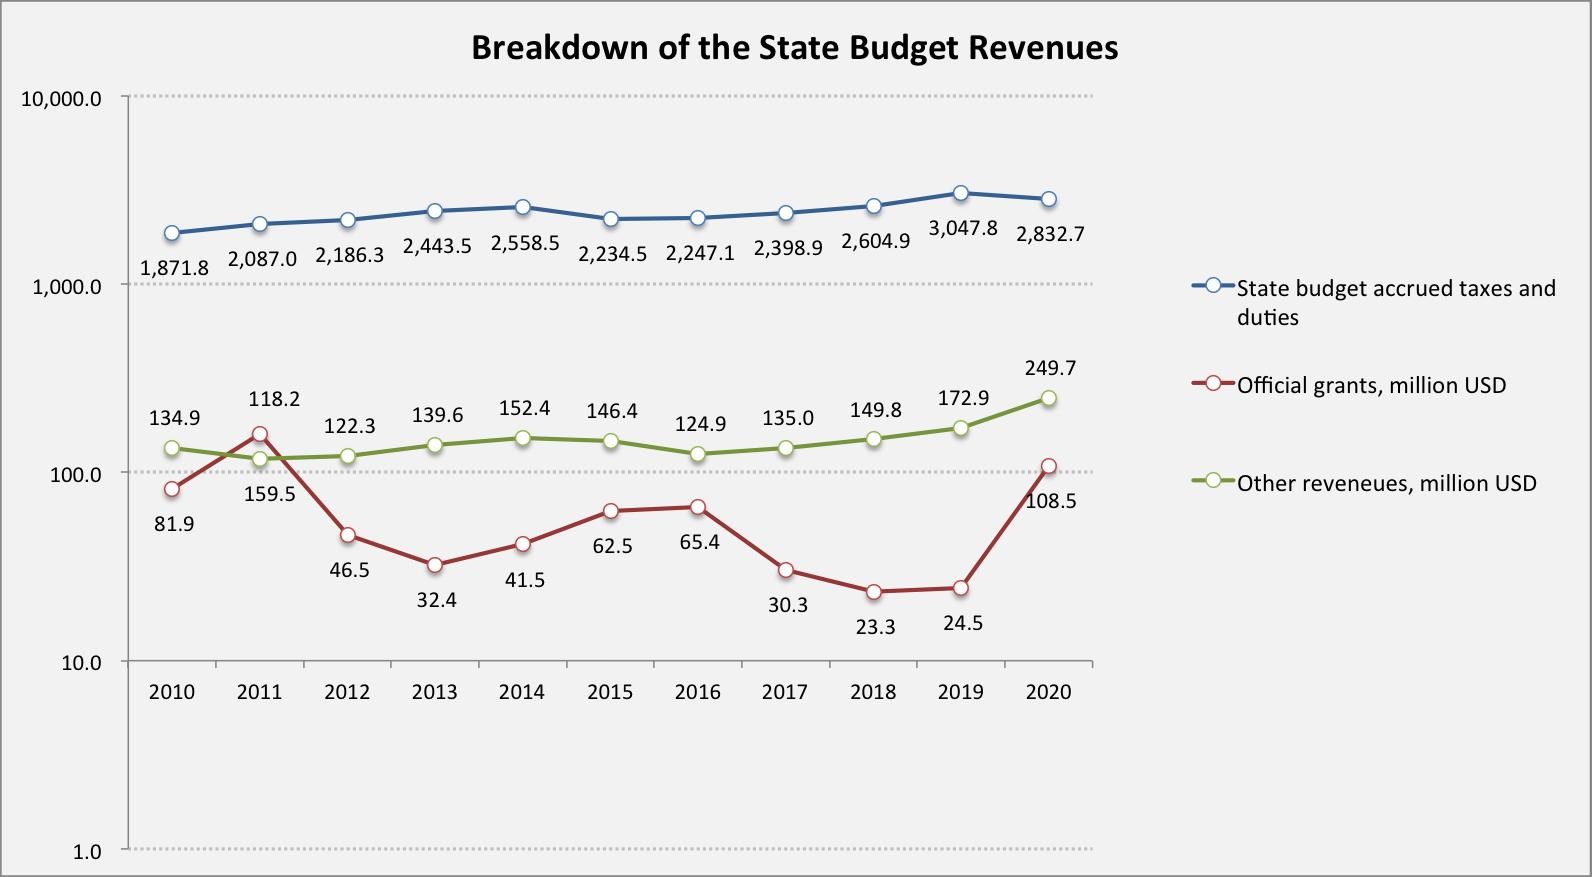
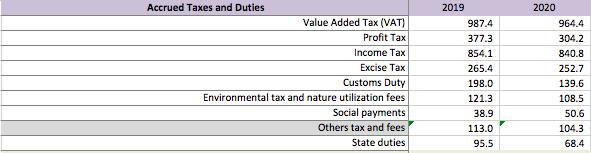
Table #2 presents major tax and duty revenue sources for 2019 and 2020. As we see, the biggest decline was in Profit Tax and Customs Duty collection.
Table #2
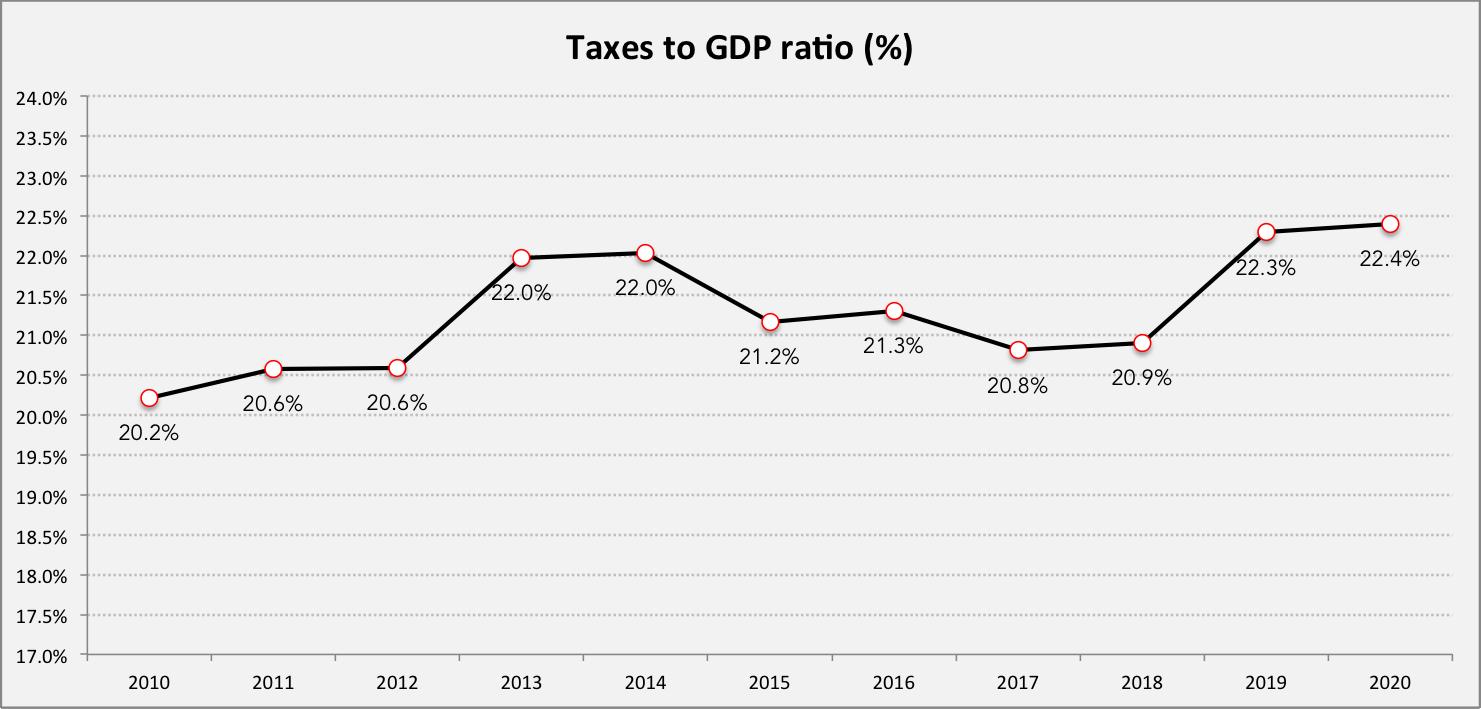
Total tax revenues (includes state duties and mandatory social insurance fees) as a percent of GDP is presented in the following graph (Graph #6). This ratio for 2020 didn’t see deterioration, which also signals that decline in tax revenues was proportional to the decline in economic activity and tax administration in large remained stable. For comparison, the average of this ratio for EOCD countries was 33.8% in 2019[1]. For Estonia, which has similar tax rates with Armenia, this ratio in 2019 was 33.1%.
Graph #6
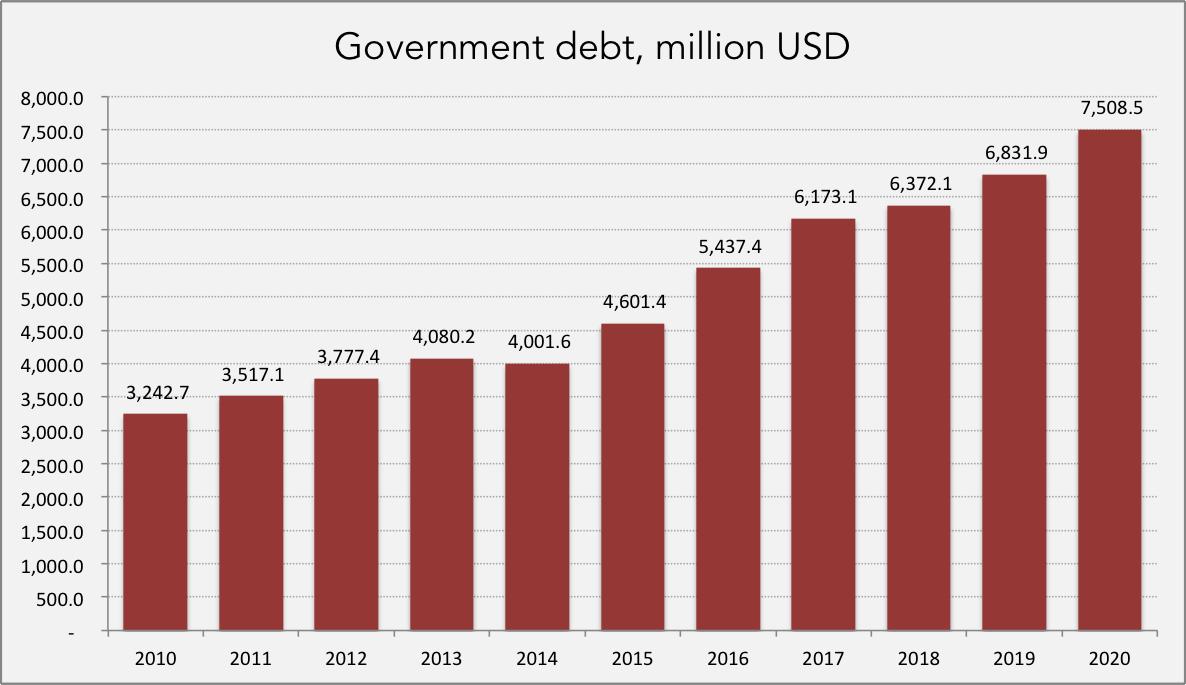
Against the aforementioned background, the government had to obtain more public debt than planned initially and as a result the government debt increased sharply. The next graph (Graph #7) shows the debt of the government per annum, starting from 2010 (expressed in USD million).
Graph #7
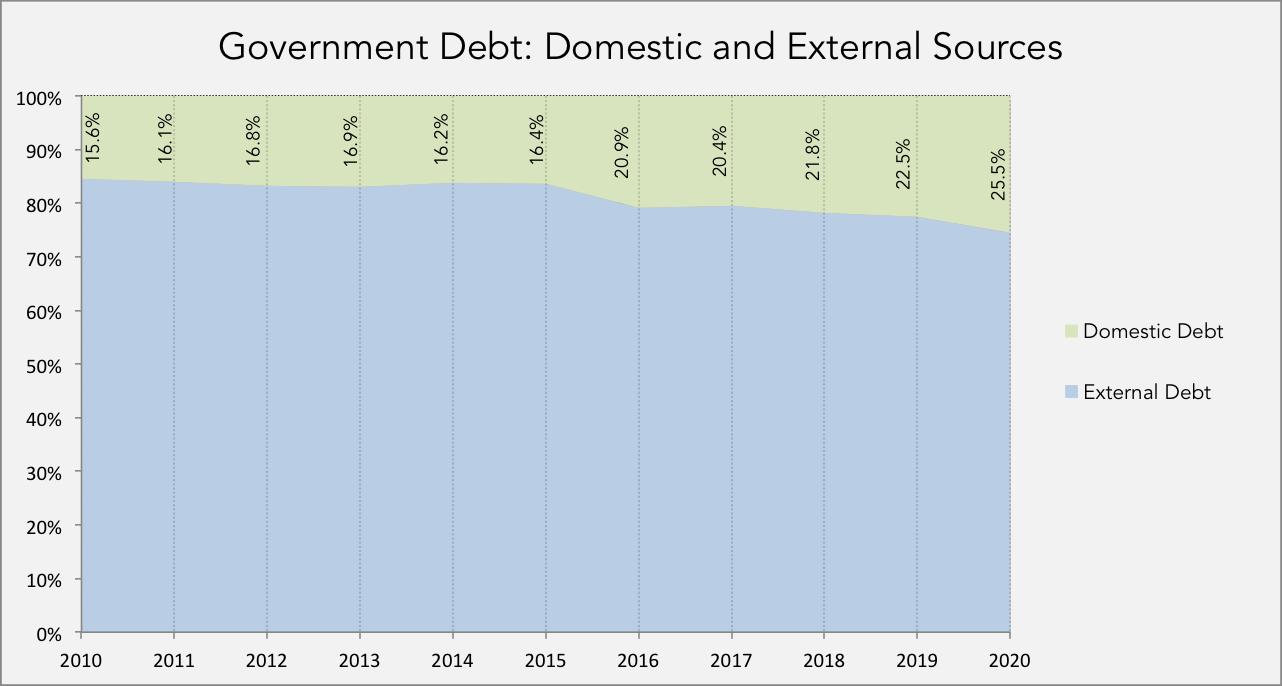
The next graph depicts sources of the government debt per external and domestic. As we see in the graph (Graph #8) ¾ of the debt is from external sources, which is posing additional risks to the debt manageability. The share of domestic debt in the total government debt is gradually increasing, which a positive trend as domestic debt predominantly is in national currency (in 2020 only 4.2% of the domestic debt was in foreign currency).
Graph #8
As government debt keeps rising, debt service[2] rises as well. The following graph (Graph #9) depicts curves for interest and principle payments towards the government debt service expressed in USD million.
Graph #9
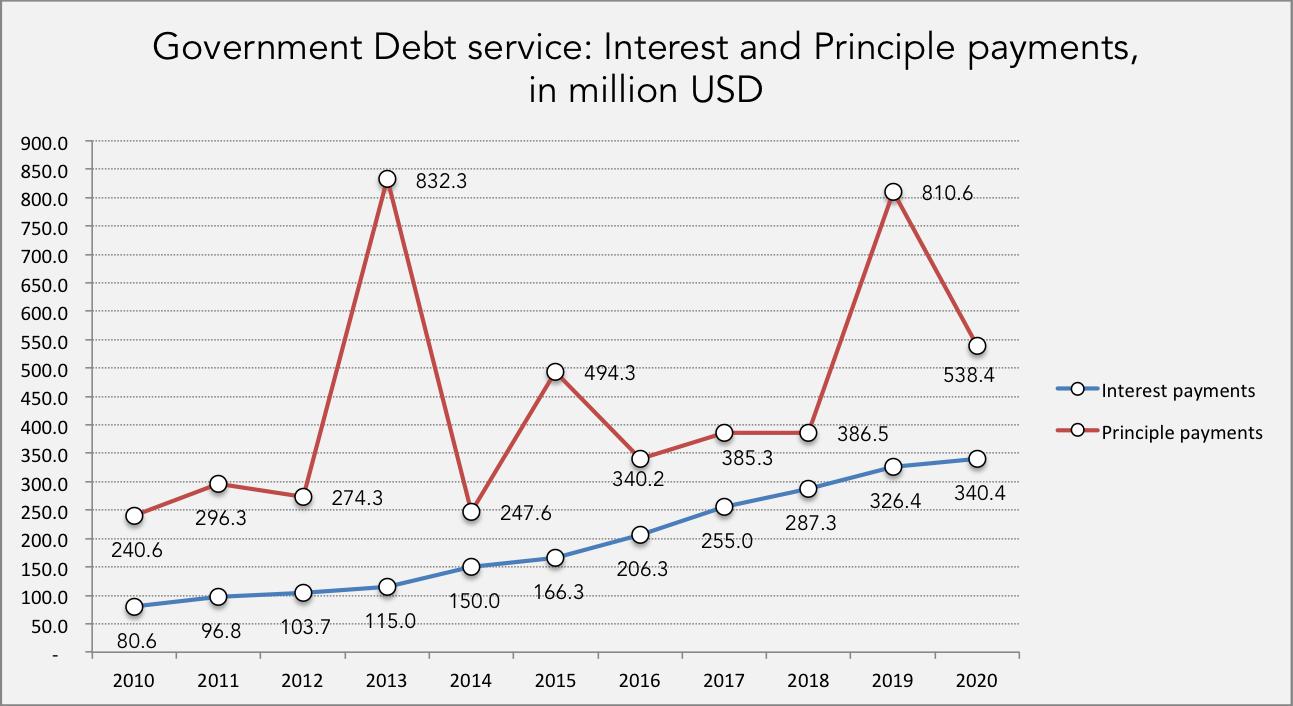
On the curve for principle payments (red line) sharp increased data points show principle payments towards Eurobonds. As we see in the graph, interest payments are steadily rising, which poses additional burden on the state budget and causes the fiscal space to shrink gradually leaving less room for capital expenditures.
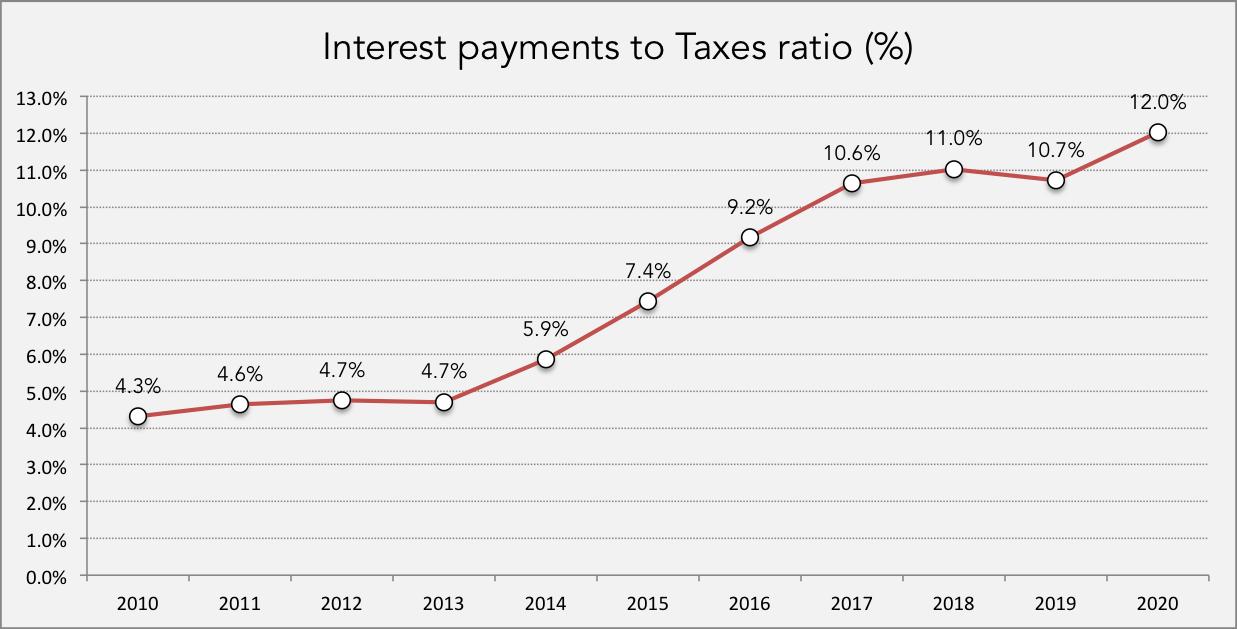
As the next graph shows (Graph #10), interest payments towards the government debt service comprised 12% of the tax revenues (including state duties and mandatory social insurance payments) in 2020.
Graph #10
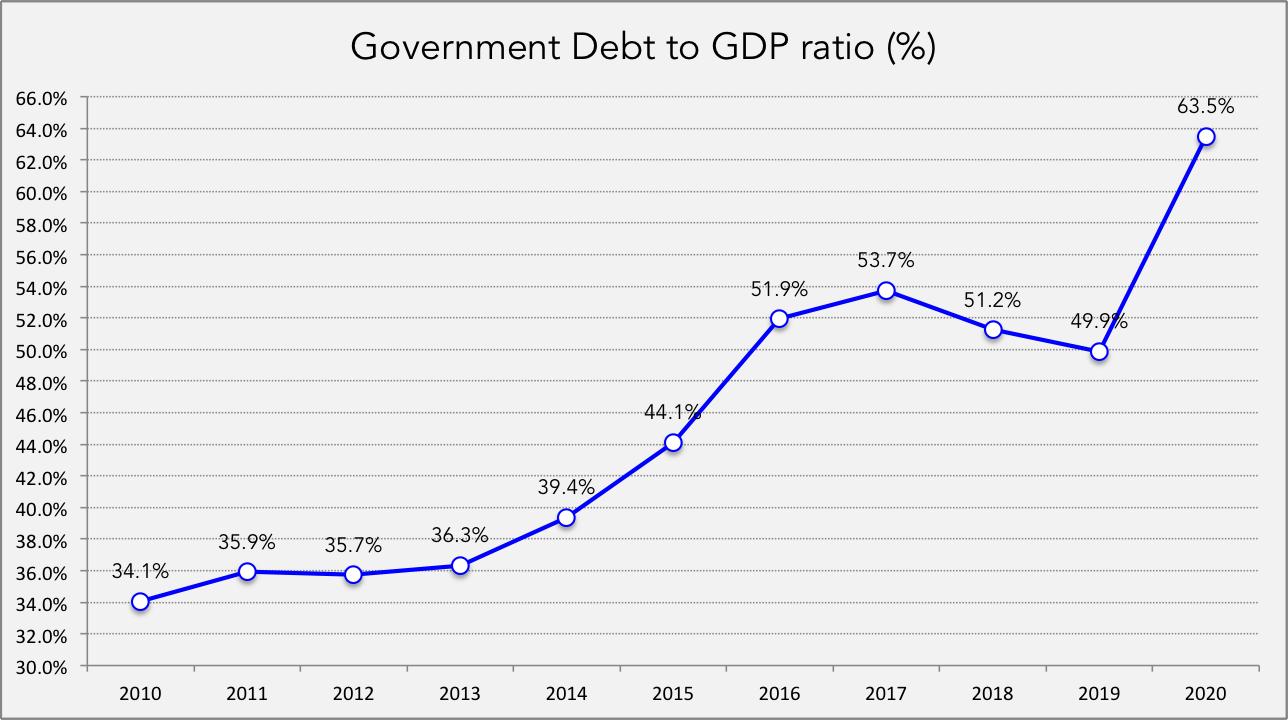
Government debt was rising by a larger rate than the economy (expressed in GDP). This is why the government debt to GDP ratio increased considerably (Graph #11). In 2020, this ratio rose sharply by 13.6%, as the government debt increased by USD 676.6 million in 2020 compared to 2019 and GDP declined by 7.6% for the same period.
Graph #11
As we saw, the pandemic affected the economy and consequently the public finance dramatically. The extent of these negative consequences is also due to the government’s ability to respond and manage the pandemic situation in Armenia. As the situation in the country is still critical and the vaccination process is going very slowly, negative socio-economic developments are still on the horizon. This situation is further exacerbated as the country is going through political crisis caused by the war and deteriorated trust towards the current PM and the government.
(Hovhannes Avetisyan is an expert in public policy and governance, concentration in public finance.)
Note: All the graphs and tables in this text were prepared based on official publications by the Statistical Committee and the Ministry of Finance of Armenia.
--------------------------------------------------------------------
[1] Source: https://www.oecd.org/ctp/revenue-statistics-2522770x.htm
[2] In the law on Public Debt of Armenia, debt service term is referred to interest payments only. In this text, the “debt service” term is referred to interest payments plus principle payments.
Write a comment