 Videos
 Photos


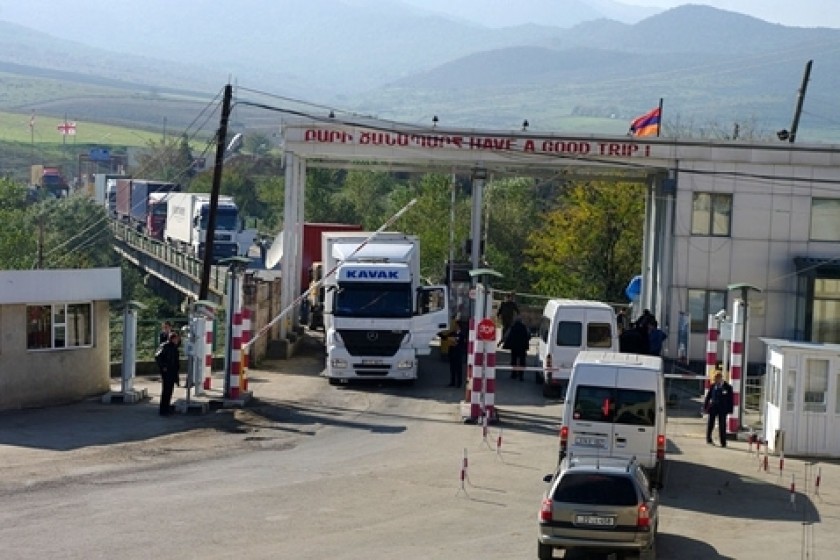
Armenia Exporting More to Customs Union, but Dollar Value Still Less than Exports to Europe
Given all the speculation revolving around Armenia’s stated willingness to join the Russia-led Customs Union, let’s take a look at Armenia’s actual import/export trade figures (as supplied by the National Statistical Service).
Despite a fall in the actual tonnage of Armenia’s exports to the European Union over the past three years, the dollar value of these exports remain greater than the dollar value of Armenian exports to Customs Union member states.
The same holds true for Armenian imports. Given the dependence of Armenia on Russian gas and grains, the total tonnage of imports from Russia has increased considerably. However the dollar value of total Armenian imports from the Customs Union is still less than imports from the European Union.
|
2012 |
Exports (Tons – Dollars) |
Imports (Tons – Dollars) |
||
|
European Union |
139.793 |
511.604.600 |
333.149 |
1.124.378.000 |
|
Customs Union (Total) |
128.385 |
289.783.400 |
2.191.814 |
1.099.901.700 |
|
Russia |
125.687 |
279.109.000 |
2.148.435 |
1.057.416.400 |
|
Kazakhstan |
1.134 |
3.964.100 |
33.335 |
8.896.500 |
|
Belarus |
1.564 |
6.710.300 |
10.044 |
33.588.800 |
So what exactly does Armenia export to the European Union? Simply put – 79% (111,378 tons) of what Armenia exported to the E.U. in 2012 was mining materials (ore, slag and ash). The main buyers were Bulgaria, Switzerland, Spain and Belgium. The second biggest export was copper and copper items – 9,897 tons. “Black Metals” came in third place – 86,864 tons.
Imports from the E.U. remain in the mineral fuels sector – gasoline and related products, bituminous products, wax, etc – for a total of 144,134 tons (or 44% of total imports). Armenia also imported some 36,000 tons of aboveground transportation equipment and parts from Germany. In 2012, Armenia also imported 14,642 tons of “manufactured food remains and livestock feed” from the E.U.
|
2011 |
Exports (Tons – Dollars) |
Imports (Tons – Dollars) |
||
|
European Union |
126.979 |
607.403.200 |
409.816 |
1.167.844.500 |
|
Customs Union (Total) |
87.633 |
232.622.500 |
1.720.134 |
945.793.600 |
|
Russia |
85.675 |
222.273.700 |
1.624.439 |
890.873.200 |
|
Kazakhstan |
690 |
4.398.500 |
87.362 |
25.335.900 |
|
Belarus |
1.268 |
5.950.300 |
8.333 |
29.574.500 |
As for Armenian exports to the Customs Union (the lion’s share going to Russia), 48% was in the form of alcoholic and non-alcoholic beverages and vinegar. Russia is also a large market for Armenian fruit – 24,000 tons last year. An additional 10,797 tons of salt, sulfur, earth and stone, cement and limestone was exported to Russia.
|
2010 |
Exports (Tons - Dollars |
Imports (Tons – Dollars) |
||
|
European Union |
134,923 |
501,120, 000 |
410, 536 |
1,026, 945,400 |
|
Customs Union (Total) |
71,177 |
168,171, 800 |
1, 664, 604 |
879, 045, 400 |
|
Russia |
68,541 |
160.507.800 |
1.628.752 |
835,271,700 |
|
Kazakhstan |
1,163 |
3,083,300 |
23,796 |
11,864.400 |
|
Belarus |
1,473 |
4,580,700 |
12,056 |
31,909.300 |
Naturally, Russian gas remains Armenia’s largest import from the Customs Union. Gas comprises 70% of total Russian imports. Russian grain comes in second at 475,480 tons. Almost everything Armenia imports from Kazakhstan is also in the form of grains.
Write a comment